
This is a very happy question asked by a student during customer service.
We were going over the fundamentals of Lean with a class of students – the Seven Wastes.
We explained the Seven Wastes, why HONSHA.org works with the seven and not eight (or more), etc., and then went on to explain the Standardized Work Diagram and the elements that make it up.
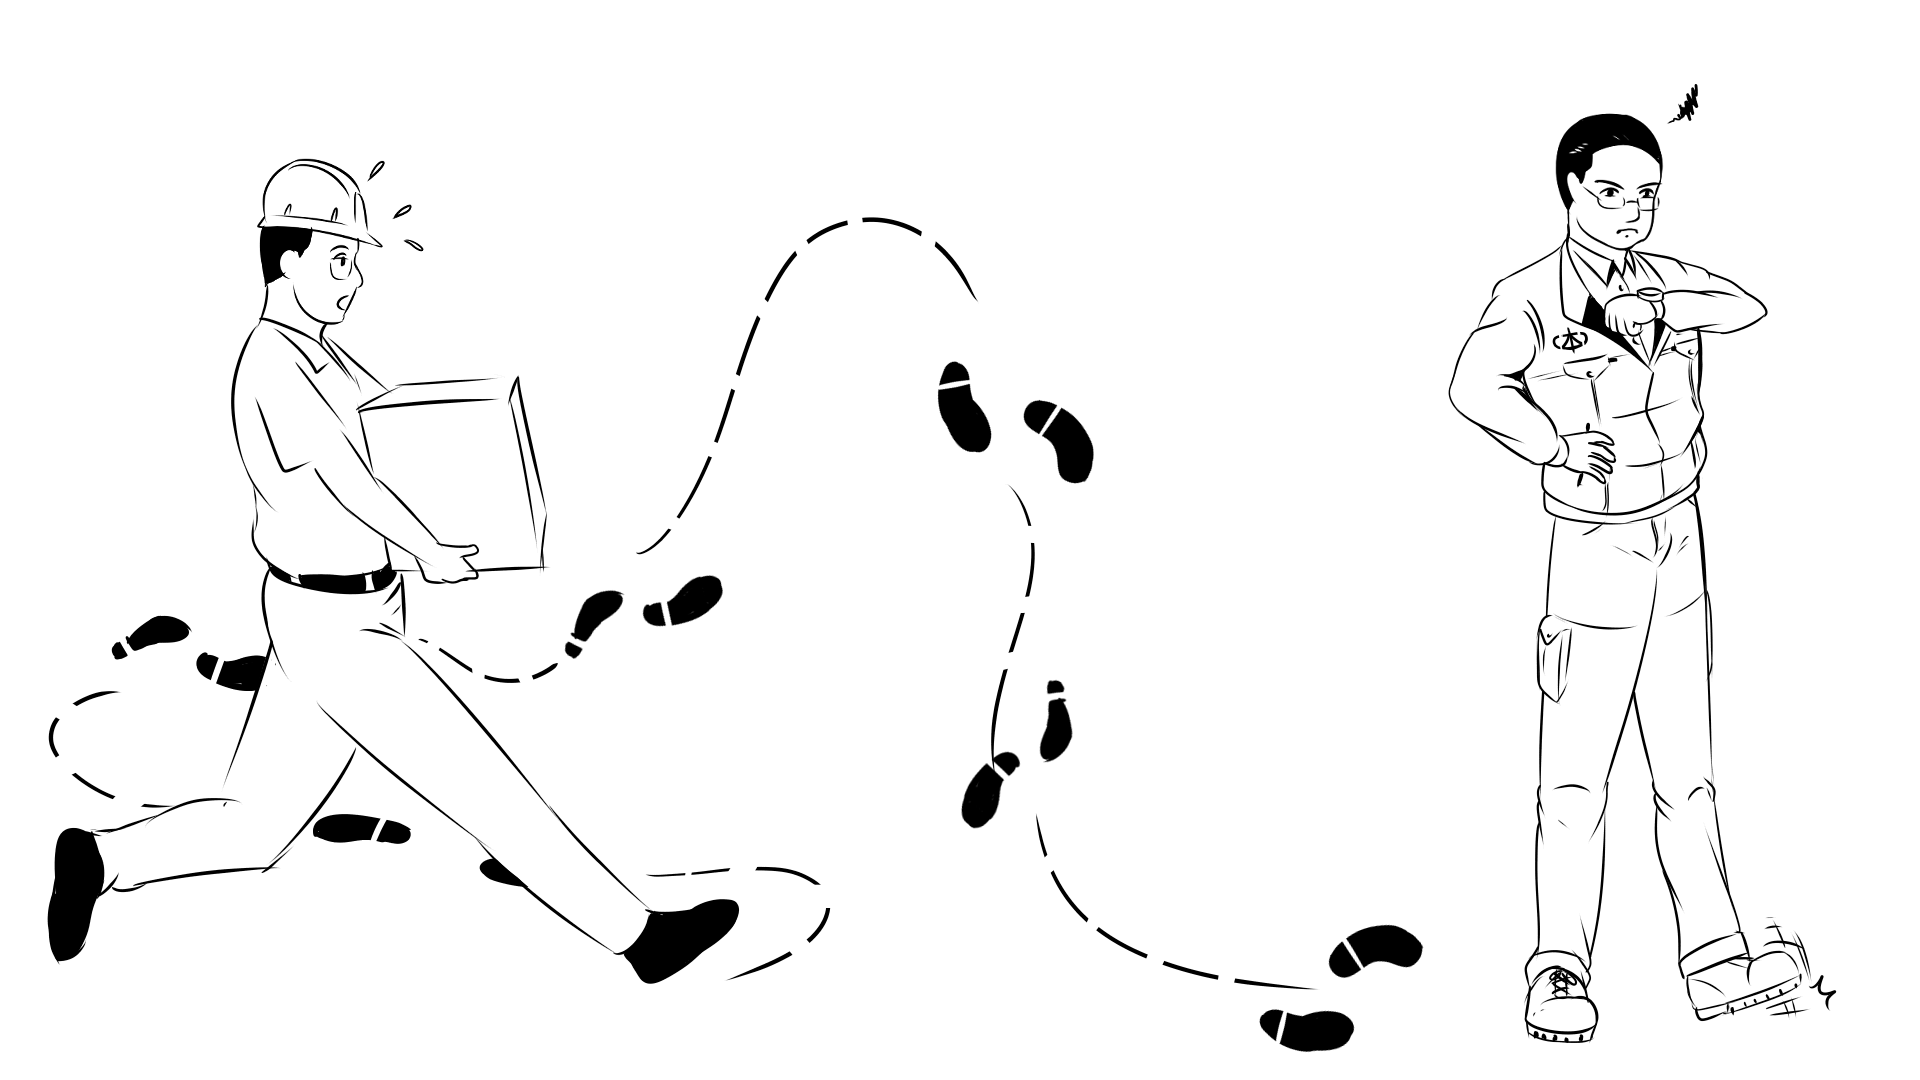
The Standardized Work Diagram (or spaghetti diagram) is one of the elements that make up Standardized Work. It graphically describes how the work is carried out in the observed process. It contains information on the elements that make up the process (machines, equipment, standard stock in process) as well as the movement of the employee to carry it out (related to the standardized work combination sheet), as well as points of attention with regard to safety and quality.
When we explained how standard work in process is described, a debate arose about the importance of getting to grips with the basic concepts of the Toyota Production System.
What is the purpose of Standardized Work? Isn’t it to eliminate MURI, MURA and MUDA (overload, variability and waste)? Isn’t inventory one of the Seven Wastes? So why do we allow standard in-process stock? Why don’t we allow a standard waiting time?
It’s a delight when these questions arise.
If you’ve never stopped to think about it, stop reading the article and do the mental exercise. It’s very good for retaining the concepts.
The Seven Wastes were defined by the Father of TPS, Taiichi Ohno, to show his disciples what to look out for and what to eliminate during day-to-day work.
They are
Defect
Over-processing
Waiting
Transportation
Inventory
Movement
Overproduction
Which of the 7 wastes are inversely related to adding value for the employee? Why do we focus on these wastes?
The wastes directly related to an employee are Waiting and Handling. All efforts to eliminate them are justified. Even stock, which we allow to exist, as long as it is kept to a minimum.
This happens, for example, right after a heat treatment process. The part comes out of the process hot and needs time to cool down until it reaches a temperature that is safe for the employee to handle in the next process. So that the employee in the next process doesn’t have to wait for the part to cool down, an in-process stock quantity is allowed.
How do you calculate this quantity? How do you convert cooling time into quantity? Try calculating before reading on.
Measure the cooling time.
Divide this time by the process takt.
Admitting a standard waiting time, to conclude, you see, would be to standardize a non-added value, which goes against the principle of TPS – the Toyota Production System. If we did this, we would be haunted by the spirit of Taiichi Ohno!
Thank you very much for reading! See you next time!
Dário Yanagita (d.yanagita@honsha.org)
Dário has 30 years’ experience in the automotive industry in Brazil, including 15 years working for Toyota do Brasil. He has varied expertise in machining, assembly, logistics, quality and the environment. He has implemented Lean production lines, Kaizen programs, managed team development plans and Lean transformation in companies.
Alecsandro Modanez (a.modanez@honsha.org)
Modanez worked for more than 20 years at Toyota do Brasil. During this time, he has had the opportunity to work in various production areas and is a specialist in Quality, Stamping and Painting. He was also responsible for training internal and supplier teams in TPS, FMDS, 5S, TJI and Toyota Business Practice. He was trained by Toyota Japan and Toyota do Brasil.
Click here to read other articles from Honsha.ORG.
Follow us on YouTube.


